Heroes
Patch 2026-09-29.
| Hero | Grade | Win rate | vs avg | vs last patch | Wins–Losses | Pick share | Ban rate |
|---|---|---|---|---|---|---|---|
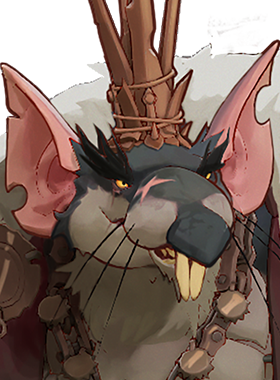 Rat King | S | 56.4% ± 0.2 (n=292,772) | +6.4 pp | — | 165,029–127,743 | 6.3% | 0.0% |
 Paige | S | 55.6% ± 0.3 (n=149,790) | +5.6 pp | +0.9 pp | 83,352–66,438 | 3.2% | 0.7% |
 Graves | S | 55.3% ± 0.3 (n=132,173) | +5.3 pp | +0.5 pp | 73,152–59,021 | 2.8% | 2.2% |
 Kelvin | S | 54.4% ± 0.4 (n=69,930) | +4.4 pp | +0.3 pp | 38,045–31,885 | 1.5% | 1.1% |
 Seven | S | 54.0% ± 0.3 (n=124,770) | +4.0 pp | +0.1 pp | 67,425–57,345 | 2.7% | 0.4% |
 Ivy | S | 54.0% ± 0.3 (n=95,644) | +4.0 pp | +1.7 pp | 51,648–43,996 | 2.1% | 0.4% |
 Haze | S | 53.4% ± 0.2 (n=227,941) | +3.4 pp | +1.4 pp | 121,758–106,183 | 4.9% | 3.9% |
 Victor | S | 53.0% ± 0.3 (n=104,917) | +3.0 pp | -2.6 pp | 55,610–49,307 | 2.3% | 2.3% |
 Wraith | A | 52.8% ± 0.2 (n=154,327) | +2.8 pp | +4.0 pp | 81,532–72,795 | 3.3% | 2.6% |
 Baba | A | 52.2% ± 0.3 (n=130,153) | +2.2 pp | — | 67,974–62,179 | 2.8% | 0.0% |
 Apollo | A | 52.1% ± 0.4 (n=76,123) | +2.1 pp | -0.3 pp | 39,696–36,427 | 1.6% | 2.5% |
 Dynamo | A | 52.0% ± 0.3 (n=95,954) | +2.0 pp | -0.3 pp | 49,926–46,028 | 2.1% | 1.7% |
 Abrams | A | 51.4% ± 0.3 (n=104,668) | +1.4 pp | -0.5 pp | 53,795–50,873 | 2.3% | 0.3% |
 Lash | A | 51.3% ± 0.2 (n=169,324) | +1.3 pp | +1.0 pp | 86,788–82,536 | 3.6% | 2.3% |
 Vyper | A | 51.0% ± 0.4 (n=48,650) | +1.0 pp | -0.4 pp | 24,822–23,828 | 1.0% | 1.1% |
 Vindicta | B | 50.5% ± 0.3 (n=117,827) | +0.5 pp | -0.5 pp | 59,506–58,321 | 2.5% | 2.6% |
 Celeste | B | 50.1% ± 0.3 (n=83,656) | +0.1 pp | +0.3 pp | 41,881–41,775 | 1.8% | 3.3% |
 Drifter | B | 49.8% ± 0.3 (n=149,573) | -0.2 pp | -0.6 pp | 74,483–75,090 | 3.2% | 1.2% |
 Calico | B | 49.5% ± 0.3 (n=81,132) | -0.5 pp | -3.3 pp | 40,192–40,940 | 1.7% | 1.3% |
 Yamato | B | 49.4% ± 0.3 (n=102,326) | -0.6 pp | -2.0 pp | 50,575–51,751 | 2.2% | 1.7% |
 Holliday | B | 49.1% ± 0.3 (n=83,986) | -0.9 pp | +1.2 pp | 41,275–42,711 | 1.8% | 0.8% |
 Mo & Krill | B | 49.0% ± 0.3 (n=111,100) | -1.0 pp | -4.1 pp | 54,487–56,613 | 2.4% | 2.2% |
 Lady Geist | C | 48.9% ± 0.3 (n=89,614) | -1.1 pp | -2.5 pp | 43,837–45,777 | 1.9% | 0.4% |
 Nurse Harrow | C | 48.7% ± 0.6 (n=27,624) | -1.3 pp | — | 13,462–14,162 | 0.6% | 0.0% |
 Billy | C | 47.9% ± 0.3 (n=92,584) | -2.1 pp | -1.8 pp | 44,387–48,197 | 2.0% | 0.3% |
 Violet | C | 47.9% ± 0.3 (n=88,590) | -2.1 pp | — | 42,393–46,197 | 1.9% | 0.0% |
 Sinclair | C | 47.8% ± 0.5 (n=46,327) | -2.2 pp | +2.1 pp | 22,150–24,177 | 1.0% | 2.0% |
 Venator | C | 47.5% ± 0.3 (n=133,282) | -2.5 pp | +0.4 pp | 63,367–69,915 | 2.9% | 0.4% |
 Infernus | C | 47.5% ± 0.2 (n=170,788) | -2.5 pp | -0.2 pp | 81,147–89,641 | 3.7% | 1.1% |
 Silver | C | 47.5% ± 0.4 (n=71,081) | -2.5 pp | -0.8 pp | 33,765–37,316 | 1.5% | 0.5% |
 McGinnis | C | 47.5% ± 0.5 (n=45,878) | -2.5 pp | -2.1 pp | 21,783–24,095 | 1.0% | 1.2% |
 Mina | C | 47.4% ± 0.3 (n=139,363) | -2.6 pp | +0.5 pp | 66,094–73,269 | 3.0% | 0.9% |
 Bebop | D | 46.7% ± 0.2 (n=161,033) | -3.2 pp | +0.8 pp | 75,282–85,751 | 3.5% | 3.0% |
 Rem | D | 46.5% ± 0.3 (n=105,331) | -3.5 pp | -0.8 pp | 49,019–56,312 | 2.3% | 1.3% |
 Viscous | D | 46.3% ± 0.5 (n=46,919) | -3.7 pp | +0.4 pp | 21,719–25,200 | 1.0% | 0.6% |
 The Doorman | D | 45.8% ± 0.4 (n=56,225) | -4.2 pp | -0.5 pp | 25,758–30,467 | 1.2% | 3.1% |
 Pocket | D | 45.5% ± 0.3 (n=81,767) | -4.5 pp | -0.7 pp | 37,218–44,549 | 1.8% | 0.5% |
 Paradox | D | 45.5% ± 0.3 (n=100,561) | -4.5 pp | -0.0 pp | 45,733–54,828 | 2.2% | 0.6% |
 Grey Talon | D | 45.5% ± 0.4 (n=60,815) | -4.5 pp | -2.1 pp | 27,647–33,168 | 1.3% | 0.2% |
 Shiv | D | 44.9% ± 0.3 (n=109,343) | -5.1 pp | -0.8 pp | 49,055–60,288 | 2.4% | 2.1% |
 Solomon | D | 44.2% ± 0.3 (n=115,131) | -5.8 pp | — | 50,885–64,246 | 2.5% | 0.0% |
 Warden | D | 43.3% ± 0.5 (n=33,691) | -6.7 pp | -3.0 pp | 14,594–19,097 | 0.7% | 0.8% |
 Deadman Danny | D | 43.2% ± 0.3 (n=122,928) | -6.8 pp | — | 53,125–69,803 | 2.6% | 0.0% |
 Mirage | D | 43.2% ± 0.5 (n=38,007) | -6.8 pp | -0.3 pp | 16,408–21,599 | 0.8% | 0.3% |
How we calculate this
In observed win rates, ± shows half the width of the likely range; n is the number of games or appearances counted. Percentage-point differences are labeled pp.
Grades use win rates adjusted toward the overall average to reduce small-sample swings. Difference from the corresponding population average, in percentage points: S at or above +3; A at or above +1 and < +3; B > -1 and < +1; C > -3 and at or below -1; D at or below -3. A dash means not enough data. The displayed win rate is the observed rate; grades use the adjusted rate.
Win rates show observed wins divided by games, with a 95% likely range. Small samples or wide ranges are withheld. Changes compare observed win rates with the previous stored patch; a dash means no usable comparison.