Deadlock By The Numbers
Win rates for Deadlock heroes and items, computed from a sample of public matches. Every rate shows its sample size (n) and margin; rates with too few games are withheld.
Patch 2026-09-29
Top heroes
Ranked by the low end of each win rate's likely range, so a lucky small sample does not rank high.
| Hero | Win rate |
|---|---|
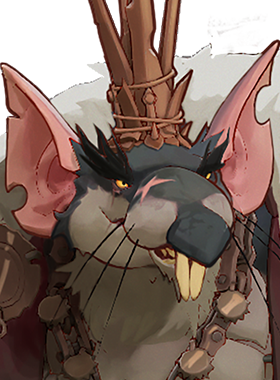 Rat King | 56.4% ± 0.2 (n=292,772) |
 Paige | 55.6% ± 0.3 (n=149,790) |
 Graves | 55.3% ± 0.3 (n=132,173) |
 Kelvin | 54.4% ± 0.4 (n=69,930) |
 Seven | 54.0% ± 0.3 (n=124,770) |
Bottom heroes
Ranked by the high end of each win rate's likely range.
| Hero | Win rate |
|---|---|
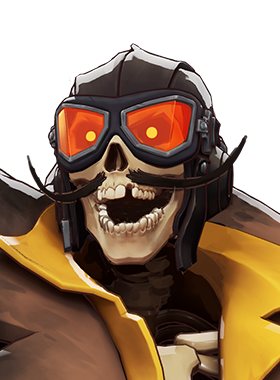 Deadman Danny | 43.2% ± 0.3 (n=122,928) |
 Mirage | 43.2% ± 0.5 (n=38,007) |
 Warden | 43.3% ± 0.5 (n=33,691) |
 Solomon | 44.2% ± 0.3 (n=115,131) |
 Shiv | 44.9% ± 0.3 (n=109,343) |
Biggest movers
Change in win rate since patch 2026-05-22, in percentage points (pp).
| Hero | Win rate | Change |
|---|---|---|
 Mo & Krill | 49.0% ± 0.3 (n=111,100) | -4.1 pp |
 Wraith | 52.8% ± 0.2 (n=154,327) | +4.0 pp |
 Calico | 49.5% ± 0.3 (n=81,132) | -3.3 pp |
| Warden | 43.3% ± 0.5 (n=33,691) | -3.0 pp |
 Victor | 53.0% ± 0.3 (n=104,917) | -2.6 pp |
Most bought items
| Item | Bought in | Pick share |
|---|---|---|
 Extra Spirit | 2,359,200 games | 50.8% |
 Improved Spirit | 2,154,176 games | 46.4% |
 Superior Cooldown | 1,753,073 games | 37.8% |
 Mystic Expansion | 1,707,532 games | 36.8% |
 Sprint Boots | 1,571,515 games | 33.8% |
How we calculate this
Win rates show observed wins divided by games, with a 95% likely range (the ± figure is half its width); n is the number of games counted. Small samples or wide ranges are withheld and those heroes are left out of the lists. Changes compare observed win rates with the previous stored patch, in percentage points (pp).
All heroes · Items · Patches · What we store