 Extra Regen ->
 Extended Magazine ->
 Titanic Magazine
3,885 games · Win rate: 49.7% (95% interval 48.1%–51.3%) · Pick share: 14.1%
Explore first-purchase history for one hero under the filters you choose.
Games matching your filters: 27,624 (27,624 matches). All games for this hero: 27,624; with a known lane: 27,624; with unknown items: 0.
Hero overall with these filters: 48.7% ± 0.6 (n=27,624). Minimum 30 games per lane hero. These are match outcomes by assigned lane.
| Hero | Games | Observed match win rate | Likely range | vs hero overall |
|---|---|---|---|---|
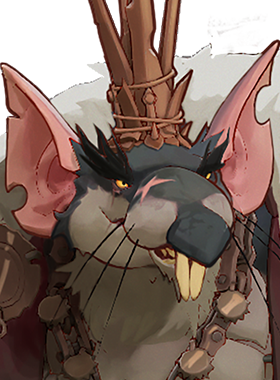 Rat King | 4,249 | 46.0% | 44.5% to 47.5% | -2.7 pp |
 Violet | 3,524 | 49.7% | 48.0% to 51.3% | +0.9 pp |
 Deadman Danny | 3,441 | 50.0% | 48.3% to 51.7% | +1.3 pp |
 Haze | 2,096 | 45.2% | 43.1% to 47.3% | -3.6 pp |
 Paige | 2,027 | 45.7% | 43.6% to 47.9% | -3.0 pp |
 Bebop | 1,887 | 50.9% | 48.6% to 53.1% | +2.1 pp |
 Wraith | 1,810 | 45.8% | 43.5% to 48.1% | -2.9 pp |
 Infernus | 1,802 | 50.3% | 48.0% to 52.6% | +1.6 pp |
 Graves | 1,788 | 43.3% | 41.0% to 45.6% | -5.4 pp |
 Drifter | 1,690 | 48.6% | 46.3% to 51.0% | -0.1 pp |
 Lash | 1,652 | 47.6% | 45.2% to 50.0% | -1.2 pp |
 Solomon | 1,396 | 54.8% | 52.2% to 57.4% | +6.1 pp |
 Vindicta | 1,351 | 49.9% | 47.2% to 52.6% | +1.2 pp |
 Dynamo | 1,306 | 49.7% | 47.0% to 52.4% | +1.0 pp |
 Shiv | 1,294 | 50.8% | 48.1% to 53.5% | +2.0 pp |
 Ivy | 1,244 | 44.5% | 41.8% to 47.3% | -4.2 pp |
 Venator | 1,242 | 52.3% | 49.6% to 55.1% | +3.6 pp |
 Paradox | 1,206 | 51.4% | 48.6% to 54.2% | +2.7 pp |
 Mina | 1,184 | 51.7% | 48.8% to 54.5% | +3.0 pp |
 Seven | 1,128 | 48.4% | 45.5% to 51.3% | -0.3 pp |
 Yamato | 1,090 | 48.8% | 45.8% to 51.8% | +0.1 pp |
 Rem | 1,089 | 51.4% | 48.5% to 54.4% | +2.7 pp |
 Kelvin | 1,023 | 43.9% | 40.9% to 46.9% | -4.8 pp |
 Victor | 1,010 | 44.6% | 41.5% to 47.6% | -4.2 pp |
 Baba | 995 | 44.6% | 41.6% to 47.7% | -4.1 pp |
 Abrams | 988 | 44.5% | 41.5% to 47.6% | -4.2 pp |
 Mo & Krill | 961 | 50.1% | 46.9% to 53.2% | +1.3 pp |
 Pocket | 950 | 53.2% | 50.0% to 56.3% | +4.4 pp |
 Celeste | 897 | 48.9% | 45.7% to 52.2% | +0.2 pp |
 Lady Geist | 886 | 51.5% | 48.2% to 54.7% | +2.7 pp |
 Apollo | 882 | 46.0% | 42.8% to 49.3% | -2.7 pp |
 Calico | 862 | 46.5% | 43.2% to 49.9% | -2.2 pp |
 Holliday | 856 | 52.8% | 49.5% to 56.1% | +4.1 pp |
 Grey Talon | 756 | 53.7% | 50.1% to 57.2% | +5.0 pp |
 Billy | 716 | 48.3% | 44.7% to 52.0% | -0.4 pp |
 Silver | 696 | 53.3% | 49.6% to 57.0% | +4.6 pp |
 The Doorman | 571 | 55.9% | 51.8% to 59.9% | +7.1 pp |
 Viscous | 568 | 48.2% | 44.2% to 52.3% | -0.5 pp |
 McGinnis | 567 | 48.5% | 44.4% to 52.6% | -0.2 pp |
 Sinclair | 477 | 48.8% | 44.4% to 53.3% | +0.1 pp |
 Vyper | 455 | 48.1% | 43.6% to 52.7% | -0.6 pp |
 Mirage | 353 | 57.8% | 52.6% to 62.8% | +9.1 pp |
 Warden | 256 | 57.8% | 51.7% to 63.7% | +9.1 pp |
| Hero | Games | Observed match win rate | Likely range | vs hero overall |
|---|---|---|---|---|
| Violet | 1,989 | 46.2% | 44.0% to 48.4% | -2.5 pp |
| Rat King | 1,757 | 54.5% | 52.1% to 56.8% | +5.7 pp |
| Haze | 1,626 | 50.4% | 47.9% to 52.8% | +1.6 pp |
| Deadman Danny | 1,561 | 45.2% | 42.7% to 47.6% | -3.6 pp |
| Wraith | 1,203 | 50.2% | 47.4% to 53.0% | +1.5 pp |
| Victor | 1,148 | 51.8% | 48.9% to 54.7% | +3.1 pp |
| Venator | 1,124 | 49.0% | 46.1% to 51.9% | +0.3 pp |
| Infernus | 959 | 48.2% | 45.0% to 51.3% | -0.6 pp |
| Abrams | 937 | 51.2% | 48.0% to 54.4% | +2.5 pp |
| Mina | 920 | 43.5% | 40.3% to 46.7% | -5.3 pp |
| Bebop | 862 | 48.8% | 45.5% to 52.2% | +0.1 pp |
| Seven | 836 | 52.5% | 49.1% to 55.9% | +3.8 pp |
| Shiv | 826 | 44.4% | 41.1% to 47.8% | -4.3 pp |
| Lash | 816 | 52.2% | 48.8% to 55.6% | +3.5 pp |
| Billy | 804 | 48.3% | 44.8% to 51.7% | -0.5 pp |
| Graves | 791 | 51.7% | 48.2% to 55.2% | +3.0 pp |
| Mo & Krill | 747 | 47.0% | 43.4% to 50.6% | -1.7 pp |
| Drifter | 737 | 50.5% | 46.9% to 54.1% | +1.7 pp |
| Yamato | 629 | 46.4% | 42.6% to 50.3% | -2.3 pp |
| Baba | 596 | 52.7% | 48.7% to 56.7% | +4.0 pp |
| Celeste | 528 | 50.8% | 46.5% to 55.0% | +2.0 pp |
| Lady Geist | 525 | 48.2% | 43.9% to 52.5% | -0.5 pp |
| Vindicta | 473 | 52.0% | 47.5% to 56.5% | +3.3 pp |
| Apollo | 462 | 53.0% | 48.5% to 57.5% | +4.3 pp |
| Silver | 458 | 45.2% | 40.7% to 49.8% | -3.5 pp |
| Paradox | 437 | 44.6% | 40.0% to 49.3% | -4.1 pp |
| Solomon | 420 | 37.9% | 33.3% to 42.6% | -10.9 pp |
| Pocket | 381 | 44.6% | 39.7% to 49.6% | -4.1 pp |
| Holliday | 363 | 46.8% | 41.8% to 52.0% | -1.9 pp |
| Vyper | 288 | 50.3% | 44.6% to 56.1% | +1.6 pp |
| Dynamo | 278 | 45.3% | 39.6% to 51.2% | -3.4 pp |
| Calico | 276 | 44.2% | 38.5% to 50.1% | -4.5 pp |
| Grey Talon | 240 | 38.8% | 32.8% to 45.0% | -10.0 pp |
| Ivy | 229 | 60.7% | 54.2% to 66.8% | +12.0 pp |
| Warden | 218 | 43.6% | 37.2% to 50.2% | -5.2 pp |
| Paige | 207 | 51.2% | 44.4% to 57.9% | +2.5 pp |
| Mirage | 175 | 41.7% | 34.7% to 49.1% | -7.0 pp |
| McGinnis | 156 | 48.7% | 41.0% to 56.5% | -0.0 pp |
| Rem | 147 | 47.6% | 39.7% to 55.7% | -1.1 pp |
| Kelvin | 137 | 51.8% | 43.5% to 60.0% | +3.1 pp |
| Sinclair | 137 | 42.3% | 34.4% to 50.7% | -6.4 pp |
| The Doorman | 111 | 48.6% | 39.6% to 57.8% | -0.1 pp |
| Viscous | 100 | 46.0% | 36.6% to 55.7% | -2.7 pp |
Each column lists the next purchase in games that bought the items chosen so far. Clicking an item replaces that choice and clears later choices.
27,624 games with the items chosen so far.
Showing 21 of 21 items; minimum 30 games.
| Item | Games | Win rate | Pick share | Typical time |
|---|---|---|---|---|
Extra RegenWin rate impactWin rate impact: not enough data |
19,042 | 48.9% (95% interval 48.2%–49.6%) | 68.9% | 1:21 |
Extended MagazineWin rate impactWin rate impact: not enough data |
1,661 | 50.6% (95% interval 48.2%–53.0%) | 6.0% | 1:27 |
Restorative ShotWin rate impactWin rate impact: not enough data |
1,411 | 44.6% (95% interval 42.1%–47.3%) | 5.1% | 1:22 |
Extra SpiritWin rate impactWin rate impact: not enough data |
1,324 | 50.8% (95% interval 48.1%–53.4%) | 4.8% | 1:30 |
Golden Goose EggWin rate impactWin rate impact: not enough data |
762 | 46.1% (95% interval 42.6%–49.6%) | 2.8% | 1:19 |
High-Velocity RoundsWin rate impactWin rate impact: not enough data |
384 | 50.3% (95% interval 45.3%–55.2%) | 1.4% | 1:25 |
Extra ChargeWin rate impactWin rate impact: not enough data |
377 | 47.7% (95% interval 42.8%–52.8%) | 1.4% | 1:38 |
Rapid RoundsWin rate impactWin rate impact: not enough data |
371 | 47.2% (95% interval 42.1%–52.3%) | 1.3% | 1:25 |
Headshot BoosterWin rate impactWin rate impact: not enough data |
282 | 46.1% (95% interval 40.4%–51.9%) | 1.0% | 1:21 |
Mystic ExpansionWin rate impactWin rate impact: not enough data |
242 | 49.2% (95% interval 42.9%–55.4%) | 0.9% | 1:36 |
Mystic RegenerationWin rate impactWin rate impact: not enough data |
219 | 45.7% (95% interval 39.2%–52.3%) | 0.8% | 1:30 |
Monster RoundsWin rate impactWin rate impact: not enough data |
196 | 48.0% (95% interval 41.1%–54.9%) | 0.7% | 1:20 |
Extra StaminaWin rate impactWin rate impact: not enough data |
131 | 50.4% (95% interval 41.9%–58.8%) | 0.5% | 1:35 |
Healing RiteWin rate impactWin rate impact: not enough data |
113 | 49.6% (95% interval 40.5%–58.6%) | 0.4% | 1:33 |
Sprint BootsWin rate impactWin rate impact: not enough data |
97 | 63.9% (95% interval 54.0%–72.8%) | 0.4% | 1:34 |
Titanic MagazineWin rate impactWin rate impact: not enough data |
93 | 43.0% (95% interval 33.4%–53.2%) | 0.3% | 3:33 |
Healing BoosterWin rate impactWin rate impact: not enough data |
56 | Unavailable (sparse evidence) | 0.2% | 3:20 |
GritWin rate impactWin rate impact: not enough data |
55 | Unavailable (sparse evidence) | 0.2% | 1:30 |
RebuttalWin rate impactWin rate impact: not enough data |
50 | Unavailable (sparse evidence) | 0.2% | 1:18 |
Extra HealthWin rate impactWin rate impact: not enough data |
36 | Unavailable (sparse evidence) | 0.1% | 1:46 |
Intensifying MagazineWin rate impactWin rate impact: not enough data |
34 | Unavailable (sparse evidence) | 0.1% | 3:10 |
Matching games unavailable. Choose an item in the column before, or an item with more games.
Matching games unavailable. Choose an item in the column before, or an item with more games.
Matching games unavailable. Choose an item in the column before, or an item with more games.
Matching games unavailable. Choose an item in the column before, or an item with more games.
Matching games unavailable. Choose an item in the column before, or an item with more games.
Showing 24 of 88 paths with 30+ games. Show more
Extra Regen -> Extended Magazine -> Titanic Magazine
3,885 games · Win rate: 49.7% (95% interval 48.1%–51.3%) · Pick share: 14.1%
Extra Regen ->  Extra Spirit -> Extended Magazine
2,374 games · Win rate: 50.5% (95% interval 48.5%–52.5%) · Pick share: 8.6%
Extra Regen -> Extra Spirit ->  Rapid Rounds
1,458 games · Win rate: 49.7% (95% interval 47.1%–52.2%) · Pick share: 5.3%
Extra Regen -> Extended Magazine -> Rapid Rounds
836 games · Win rate: 46.5% (95% interval 43.2%–49.9%) · Pick share: 3.0%
Extra Regen -> Extended Magazine -> Extra Spirit
652 games · Win rate: 46.9% (95% interval 43.1%–50.8%) · Pick share: 2.4%
Extra Regen -> Extra Spirit ->  Quicksilver Reload
608 games · Win rate: 41.4% (95% interval 37.6%–45.4%) · Pick share: 2.2%
Extra Regen ->  Extra Stamina ->
 Kinetic Dash
524 games · Win rate: 50.4% (95% interval 46.1%–54.6%) · Pick share: 1.9%
Extra Regen -> Extra Spirit ->  Healing Booster
473 games · Win rate: 47.8% (95% interval 43.3%–52.3%) · Pick share: 1.7%
Extra Regen ->  Intensifying Magazine -> Extra Stamina
407 games · Win rate: 45.9% (95% interval 41.2%–50.8%) · Pick share: 1.5%
Extra Regen -> Extra Spirit -> Titanic Magazine
318 games · Win rate: 52.2% (95% interval 46.7%–57.6%) · Pick share: 1.2%
 Restorative Shot -> Extra Regen -> Healing Booster
294 games · Win rate: 40.5% (95% interval 35.0%–46.2%) · Pick share: 1.1%
Extra Regen -> Healing Booster -> Extended Magazine
267 games · Win rate: 43.4% (95% interval 37.6%–49.4%) · Pick share: 1.0%
Extra Regen -> Restorative Shot -> Extra Stamina
265 games · Win rate: 42.3% (95% interval 36.5%–48.3%) · Pick share: 1.0%
Extended Magazine -> Extra Regen -> Titanic Magazine
227 games · Win rate: 54.2% (95% interval 47.7%–60.5%) · Pick share: 0.8%
Extra Regen -> Extended Magazine -> Healing Booster
200 games · Win rate: 43.0% (95% interval 36.3%–49.9%) · Pick share: 0.7%
Extra Regen -> Healing Booster -> Extra Spirit
194 games · Win rate: 51.5% (95% interval 44.6%–58.5%) · Pick share: 0.7%
Extra Regen -> Intensifying Magazine ->  Arcane Surge
173 games · Win rate: 42.8% (95% interval 35.6%–50.2%) · Pick share: 0.6%
Extra Spirit -> Extended Magazine -> Titanic Magazine
160 games · Win rate: 50.6% (95% interval 43.0%–58.3%) · Pick share: 0.6%
Extra Regen -> Extended Magazine ->  Extra Charge
158 games · Win rate: 50.6% (95% interval 42.9%–58.3%) · Pick share: 0.6%
Extra Regen -> Extra Spirit -> Swift Striker
157 games · Win rate: 51.6% (95% interval 43.8%–59.3%) · Pick share: 0.6%
Extended Magazine -> Titanic Magazine -> Extra Regen
149 games · Win rate: 51.0% (95% interval 43.1%–58.9%) · Pick share: 0.5%
Extra Spirit -> Extra Regen -> Extended Magazine
134 games · Win rate: 49.3% (95% interval 40.9%–57.6%) · Pick share: 0.5%
Restorative Shot -> Mystic Regeneration -> Extra Stamina
131 games · Win rate: 34.4% (95% interval 26.8%–42.8%) · Pick share: 0.5%
Extra Regen -> Extra Charge -> Extended Magazine
125 games · Win rate: 52.0% (95% interval 43.3%–60.6%) · Pick share: 0.5%
Showing 24 of 88 paths with 30+ games. Show more
Extra Regen -> Extended Magazine -> Titanic Magazine
3,885 games · Win rate: 49.7% (95% interval 48.1%–51.3%) · Pick share: 14.1%
Extra Regen -> Extra Spirit -> Extended Magazine
2,374 games · Win rate: 50.5% (95% interval 48.5%–52.5%) · Pick share: 8.6%
Extra Regen -> Extra Spirit -> Rapid Rounds
1,458 games · Win rate: 49.7% (95% interval 47.1%–52.2%) · Pick share: 5.3%
Extra Regen -> Extended Magazine -> Rapid Rounds
836 games · Win rate: 46.5% (95% interval 43.2%–49.9%) · Pick share: 3.0%
Extra Regen -> Extended Magazine -> Extra Spirit
652 games · Win rate: 46.9% (95% interval 43.1%–50.8%) · Pick share: 2.4%
Extra Regen -> Extra Spirit -> Quicksilver Reload
608 games · Win rate: 41.4% (95% interval 37.6%–45.4%) · Pick share: 2.2%
Extra Regen -> Extra Stamina -> Kinetic Dash
524 games · Win rate: 50.4% (95% interval 46.1%–54.6%) · Pick share: 1.9%
Extra Regen -> Extra Spirit -> Healing Booster
473 games · Win rate: 47.8% (95% interval 43.3%–52.3%) · Pick share: 1.7%
Extra Regen -> Intensifying Magazine -> Extra Stamina
407 games · Win rate: 45.9% (95% interval 41.2%–50.8%) · Pick share: 1.5%
Extra Regen -> Extra Spirit -> Titanic Magazine
318 games · Win rate: 52.2% (95% interval 46.7%–57.6%) · Pick share: 1.2%
Restorative Shot -> Extra Regen -> Healing Booster
294 games · Win rate: 40.5% (95% interval 35.0%–46.2%) · Pick share: 1.1%
Extra Regen -> Healing Booster -> Extended Magazine
267 games · Win rate: 43.4% (95% interval 37.6%–49.4%) · Pick share: 1.0%
Extra Regen -> Restorative Shot -> Extra Stamina
265 games · Win rate: 42.3% (95% interval 36.5%–48.3%) · Pick share: 1.0%
Extended Magazine -> Extra Regen -> Titanic Magazine
227 games · Win rate: 54.2% (95% interval 47.7%–60.5%) · Pick share: 0.8%
Extra Regen -> Extended Magazine -> Healing Booster
200 games · Win rate: 43.0% (95% interval 36.3%–49.9%) · Pick share: 0.7%
Extra Regen -> Healing Booster -> Extra Spirit
194 games · Win rate: 51.5% (95% interval 44.6%–58.5%) · Pick share: 0.7%
Extra Regen -> Intensifying Magazine -> Arcane Surge
173 games · Win rate: 42.8% (95% interval 35.6%–50.2%) · Pick share: 0.6%
Extra Spirit -> Extended Magazine -> Titanic Magazine
160 games · Win rate: 50.6% (95% interval 43.0%–58.3%) · Pick share: 0.6%
Extra Regen -> Extended Magazine -> Extra Charge
158 games · Win rate: 50.6% (95% interval 42.9%–58.3%) · Pick share: 0.6%
Extra Regen -> Extra Spirit -> Swift Striker
157 games · Win rate: 51.6% (95% interval 43.8%–59.3%) · Pick share: 0.6%
Extended Magazine -> Titanic Magazine -> Extra Regen
149 games · Win rate: 51.0% (95% interval 43.1%–58.9%) · Pick share: 0.5%
Extra Spirit -> Extra Regen -> Extended Magazine
134 games · Win rate: 49.3% (95% interval 40.9%–57.6%) · Pick share: 0.5%
Restorative Shot -> Mystic Regeneration -> Extra Stamina
131 games · Win rate: 34.4% (95% interval 26.8%–42.8%) · Pick share: 0.5%
Extra Regen -> Extra Charge -> Extended Magazine
125 games · Win rate: 52.0% (95% interval 43.3%–60.6%) · Pick share: 0.5%
Showing 24 of 32 paths with 30+ games. Show more
999 games · Win rate: 49.4% (95% interval 46.4%–52.5%) · Pick share: 3.6%
526 games · Win rate: 49.4% (95% interval 45.2%–53.7%) · Pick share: 1.9%
472 games · Win rate: 43.6% (95% interval 39.2%–48.2%) · Pick share: 1.7%
Extra Regen -> Extra Spirit -> Rapid Rounds -> Swift Striker -> Extra Stamina -> Kinetic Dash
433 games · Win rate: 52.2% (95% interval 47.5%–56.9%) · Pick share: 1.6%
Extra Regen -> Extended Magazine -> Rapid Rounds -> Extra Charge ->  Sprint Boots -> Trophy Collector
246 games · Win rate: 51.6% (95% interval 45.4%–57.8%) · Pick share: 0.9%
242 games · Win rate: 50.4% (95% interval 44.2%–56.7%) · Pick share: 0.9%
218 games · Win rate: 46.3% (95% interval 39.8%–53.0%) · Pick share: 0.8%
Extra Regen -> Extended Magazine -> Extra Spirit -> Titanic Magazine -> Rapid Rounds -> Extra Charge
210 games · Win rate: 46.7% (95% interval 40.0%–53.4%) · Pick share: 0.8%
193 games · Win rate: 41.5% (95% interval 34.7%–48.5%) · Pick share: 0.7%
180 games · Win rate: 49.4% (95% interval 42.2%–56.7%) · Pick share: 0.7%
178 games · Win rate: 53.4% (95% interval 46.0%–60.6%) · Pick share: 0.6%
169 games · Win rate: 43.8% (95% interval 36.5%–51.3%) · Pick share: 0.6%
147 games · Win rate: 55.1% (95% interval 47.0%–62.9%) · Pick share: 0.5%
115 games · Win rate: 41.7% (95% interval 33.1%–50.9%) · Pick share: 0.4%
110 games · Win rate: 45.5% (95% interval 36.5%–54.8%) · Pick share: 0.4%
Extra Regen -> Extra Spirit -> Titanic Magazine -> Healing Booster ->  Extra Health -> Arcane Surge
99 games · Win rate: 46.5% (95% interval 37.0%–56.2%) · Pick share: 0.4%
95 games · Win rate: 50.5% (95% interval 40.6%–60.4%) · Pick share: 0.3%
89 games · Win rate: Unavailable (sparse evidence) · Pick share: 0.3%
78 games · Win rate: Unavailable (sparse evidence) · Pick share: 0.3%
Extra Charge ->  Grit -> Extra Regen -> Healing Booster ->
 Guardian Ward ->
 Mystic Expansion
66 games · Win rate: Unavailable (sparse evidence) · Pick share: 0.2%
62 games · Win rate: Unavailable (sparse evidence) · Pick share: 0.2%
Extra Regen -> Extra Spirit -> Rapid Rounds -> Swift Striker -> Kinetic Dash -> Titanic Magazine
44 games · Win rate: Unavailable (sparse evidence) · Pick share: 0.2%
43 games · Win rate: Unavailable (sparse evidence) · Pick share: 0.2%
38 games · Win rate: Unavailable (sparse evidence) · Pick share: 0.1%
0 paths with 30+ games.
No common build paths for these filters.
Each position:item purchase-position lock is a retrospective condition in the selected purchase view; a future slot lock describes games that later reached it. Selection order is distinct from actual purchase-position numbers: intervening unselected purchases are allowed, and removing an item removes its condition and any lock on that item.
Assigned-lane relationships do not prove proximity throughout play. Paths describe the base cohort.
Lane tables show observed match wins, not lane wins. Each assigned opponent or lanemate counts once per selected appearance. Unknown or empty lane assignments contribute to the hero overall baseline but not a named relationship. Games can appear under multiple different lane heroes. The likely range is the configured Wilson interval for the match win rate. Differences are signed percentage points versus the hero overall in this exact cohort; they are descriptive and do not estimate a causal advantage. Rows below the effective minimum games are hidden; wider uncertain rates remain unavailable. Clicking an opponent adds it to the enemy conditions (or replaces a full pair); clicking a lanemate replaces that condition. Other filters stay active.
Lane tables use the cohort filters above, including selected purchases and purchase-position locks, but not the items chosen in the step-by-step explorer. Each lane table compares against the hero overall in that cohort. Lane tables and explorer columns are prepared separately, so right after an update one can reflect slightly newer games than the other. Clicking a lane hero changes the cohort and clears the items chosen in the explorer.
All hero, lane, selected-purchase, lock, patch, rank and scope conditions intersect the same player appearances. Explorer columns number purchases 1 through 6 in the selected view: Item 3 is exactly the third purchase. Selected purchases, in contrast, allow other purchases in between. Explicit locks require an unambiguous numbered purchase slot and remain retrospective conditions.
First valid recorded shop acquisitions count once. Base items and upgrades are separate; sales never erase history. Same-second ties cannot establish order. Unknown catalog items preserve purchase positions in both views. Major numbers tier 3/4 purchases, plus unknown placeholders.
Explorer typical time is mean acquisition time rounded down to seconds. Explorer pick share is out of all games with the items chosen so far, including games that bought nothing more. Path pick share uses the base selected-history cohort. Search and minimum pick only hide results. Win rates use the configured sample and interval gate; displayed uncertainty is a 95% Wilson interval. Reached-position rates describe completion separately. Later purchases are associated with game length, wealth and completion, not causal recommendations.
Win rate is the observed rate among buyers. Win rate impact adjusts same-tier alternatives to a common mix of purchase times, team wealth leads and ranks, relative to an average that includes the item. Its likely range is a 95% interval accounting for purchases from the same match, conditional on those alternatives and mix. Likely helps means the whole range is above zero, likely hurts below zero, and unclear includes zero. Not enough data means sample, support or display requirements failed. Unmeasured differences, repeated players across matches and future patches are not covered. Impacts do not establish cause or add up to a build win rate.
Win rate impact compares only supported alternatives within one selected population, purchase position and item tier; unavailable evidence stays unavailable. Joint continuations and full paths are observed together, never stitched from independent slot winners. Core statistics describe only that core; full-path statistics describe the full path.
 Mystic Vulnerability ->
 Duration Extender ->
 High-Velocity Rounds ->
 Opening Rounds
 Radiant Regeneration ->
 Suppressor ->
 Headshot Booster ->